You’ve wrote an awesome web app, I am sure you must be proud of it and all. but there is these little things that might bother you a little, why is the load time is slow? why isn’t it snappy?
You’ve come to the right place, let’s get right to it then, no BS.
Measure
before we do anything, let’s set a baseline, this is critical because otherwise you will not know if your changes made it better, worse or if it had no measureable difference.
Lighthouse
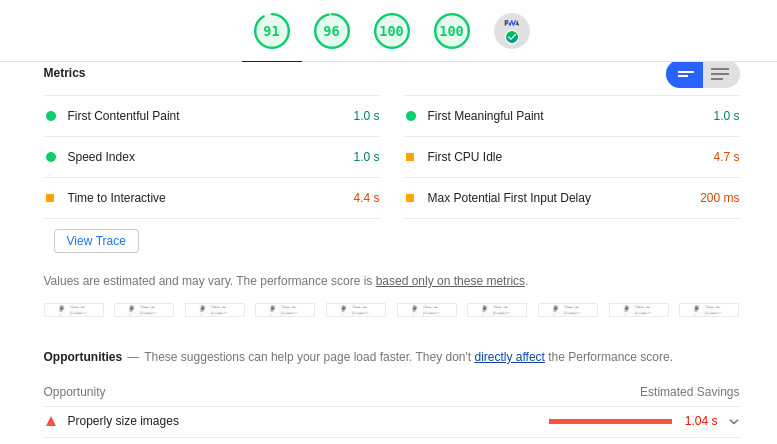
Lighthouse is one of the best tools to test your website for performance, accessibility and UX problems.
there are multiple ways that you can get your hands on lighthouse, chrome dev tools or in the cli.
Here’s what a lighthouse audit looks like:
React Profiler
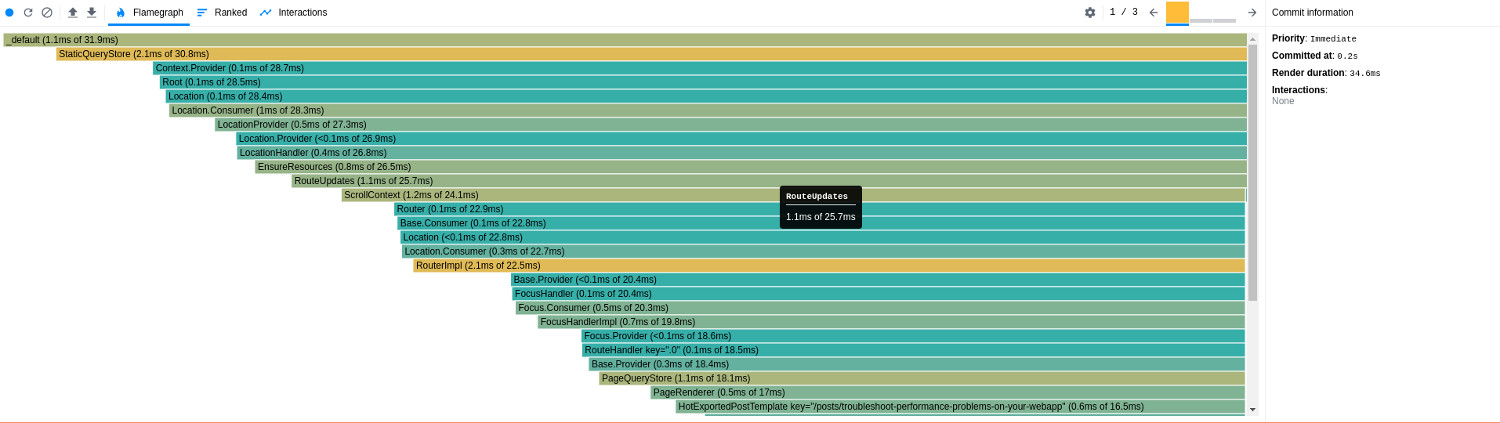
If your web-app is a written in react then you definitely want to use this tool, and it’s available on all major browsers including chrome and firefox.
Here’s what a profiling result would look like:
Chrome Performance profiler
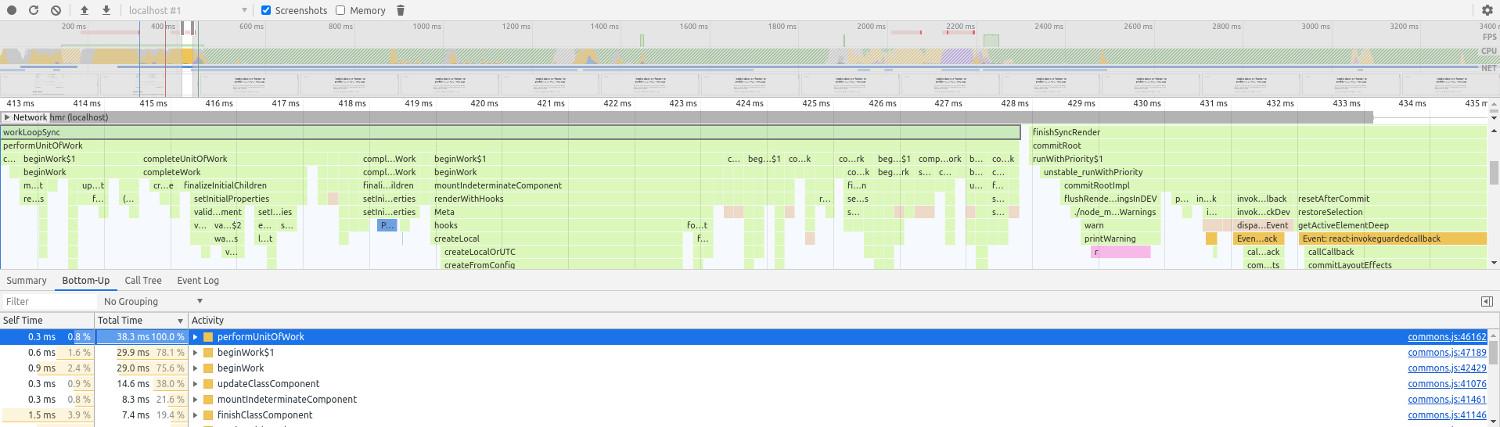
Chrome’s performance profiler is also very powerful, a typical audit comes PACKED with information, and our job is to get sense of what is going on there, I highly recommend getting used to it.
Here’s what the result would look like:
bundlephobia
bundlephobia is great on figuring out what’s the size of your dependencies, it now supports scanning package.json which is pretty cool, will save you the trouble of looking into each dependency separately.
source-map-explorer
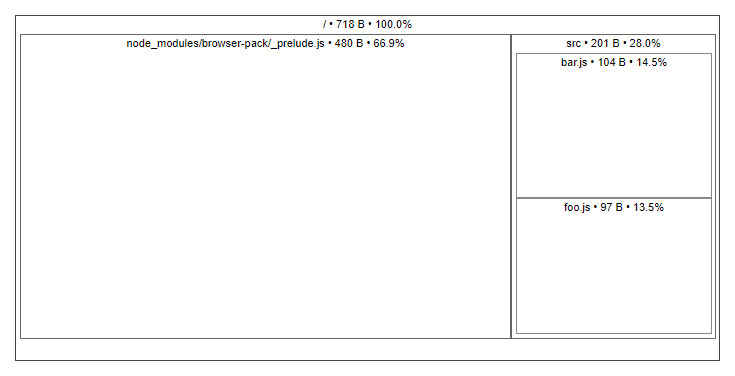
source-map-explorer is perfect for making sense of your bundle, I am sure you lazied your way and installed a couple of dependencies to do some of the heavy lifting for you, we all do it, but we gotta make sure that the cost we’re paying is worth the value provided by the dependency.
Here’s what a simple bundle would look like:
DOM tree viewer
I am sure I’ve lost you with this one, just follow me, it’ll make sense in a second.
I didn’t have much choices when it comes to this, the big idea is, we need a tool that’ll take our DOM tree and generate visual graph representation of it.
That way we can make sense of what DOM nodes are mounted that we don’t even need. or how we could optimize the depth of our component tree, to minimize the amount of nodes that our application has to mount.
I only found one good extension that does this, if you know a better alternative, please share it with us in the comments section below.
Techniques
Alright, so we have our performance metrics, now let’s get cracking, I’ll share with you a couple of easy reproducible techniques you can do to improve your web app’s performance.
Avoid unecessary re-renders
When you look at the audits, try and look for a component that renders more than once, and try to figure out why it does so.
If your app is a react app, then you can easily spot this on Profiler tab of react dev tools, especially if you enable Record why each component rendered while profiling. on the settings tab.
now that you’ve set your eyes on one component, you got to find why it’s re-rendering, this checklist might help your out:
- is component pure? if not, make it so it’ll save you so much trouble
- use
memowhen needed, it’ll memoize your component and wouldn’t re-render unless the props change. mapStateToProps, if you useredux, make sure to spread the mapping directly from the store, don’t do any computation there as it might change the prop’s reference, just defer the computation to render, or move it to the reducer if that’s possible.
Reduce mounted DOM nodes
This is where we’ll use DOM tree viewer, fire it up and look into the result, try to compare it with what you can see visually, I am sure you’ll find the nodes that shouldn’t be even mounted.
Reduce Layout shift
Have you been to a website where it restructures its layout as it loads? that’s not cool, and will hurt the perceived performance of your application, make sure to minimize that and have placeholders where needed.
Code-splitting
Code-splitting, can yield very good results if done right, and make your performance worse if done wrong, be careful and make sure to compare the metrics when you code-split anything.
Some of the factors that you need to look into when deciding what to lazy load are:
- is it necessary for the First meaningful paint?
- can we defer the logic to after the First meaningful paint?
- is it necessary on this particual route?
Question your dependencies
After looking into the bundle, you’ll find your dependencies taking a very comfy portion of your bundle. And you should ask these questions:
- am I shaking that tree correctly?
- are there other better lighter alternatives?